Project Overview
This project presents an interactive landscape maintenance operations dashboard designed to give coordinators and executives a unified view of work-order activity, operational efficiency, and financial performance. The solution brings together detailed work-order records with summary measures for completion, outstanding demand, labor use, material costs, revenue, and gross margin. Three report pages support different decision levels: a coordinator dashboard for daily operations, an executive dashboard for financial oversight, and a work-order management page for record-level review.
The Problem
Landscape maintenance operations generate many work orders across crews, routes, clients, service types, priorities, and statuses. Without a centralized reporting view, managers may struggle to identify unfinished work, compare crew performance, understand cost drivers, and recognize unprofitable routes or services. The dashboard addresses this problem by consolidating operational and financial indicators into a filterable reporting experience that supports faster scheduling, resource allocation, and performance reviews.
Data Used
The analysis uses a structured synthetic dataset containing identifiers and descriptive fields such as Work Order ID, Client Name, Route, CrewName, ServiceType, Priority, Status, Client Type, Year, Quarter, Month, and Day. It also includes operational measures such as Estimated Hours, Actual Hours, and PropertyArea in square metres, together with financial measures for Revenue, Labor Cost, Material Cost, and Gross Margin. The visible report covers work performed from April through September 2026 across seven routes, two crews, residential and commercial clients, and multiple landscape services.
Tools
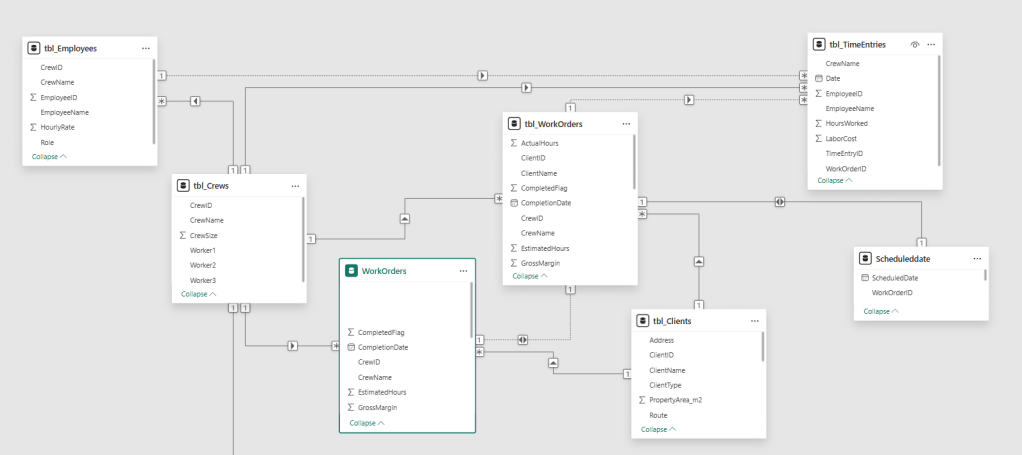
Excel served as the source and staging environment for the landscape maintenance work-order data, providing a structured format for fields such as clients, routes, crews, services, dates, hours, costs, revenue, and status. Power Query was used to import and prepare the data by performing QA/QC to make sure data has suitable data types, standardized column names, and shape the work-order table for analysis. Power BI was used to build the data model and create the three interactive report pages, including KPI cards, slicers, tables, and trend and comparison visuals for operational and executive reporting. DAX was used to create calculated measures for total work orders, completed and outstanding orders, completion rate, estimated and actual hours, crew productivity, revenue, labor cost, material cost, and gross margin, allowing the visuals to respond dynamically to user filters.
Total Work Orders =
DISTINCTCOUNT(WorkOrders[WorkOrderID])

Completed Orders =
CALCULATE(
    [Total Work Orders],
    WorkOrders[Status] = "Completed"
)

Outstanding Orders =
CALCULATE(
    [Total Work Orders],
    WorkOrders[Status] IN {"Scheduled", "In Progress", "On Hold"}
)

Completion Rate =
DIVIDE(
    [Completed Orders],
    [Total Work Orders],
    0
)


Crew Productivity =
DIVIDE(
    [Total Property Area],
    [Total Actual Hours],
    0
)

Total Labor Cost =
SUM(WorkOrders[LaborCost])

Gross Margin =
[Total Revenue] -
[Total Labor Cost] -
[Total Material Cost]
Process
- Organized the work-order records into consistent operational, customer, date, and financial fields.
- Created measures for total work orders, completed orders, outstanding orders, completion rate, total hours, productivity, revenue, costs, and gross margin.
- Segmented results by crew, client, route, service type, month, priority, status, and client type.
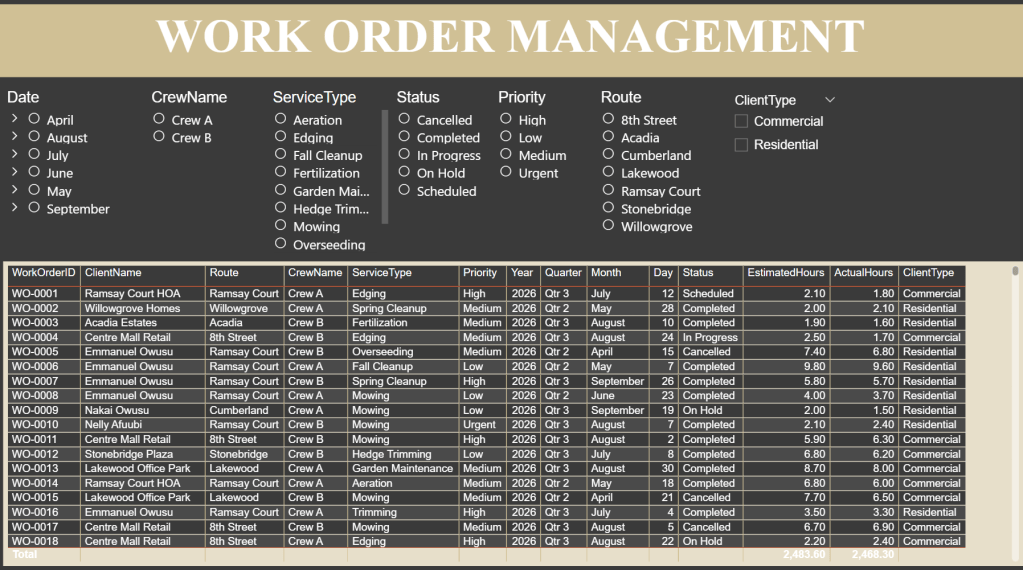
- Designed three audience-focused pages: operational coordination, executive performance, and detailed work-order management.
- Added interactive filters so users can move from headline indicators to specific crews, routes, services, dates, and order statuses.
- Validated dashboard totals and cross-checked key operational and financial measures across the report pages.
Key Findings
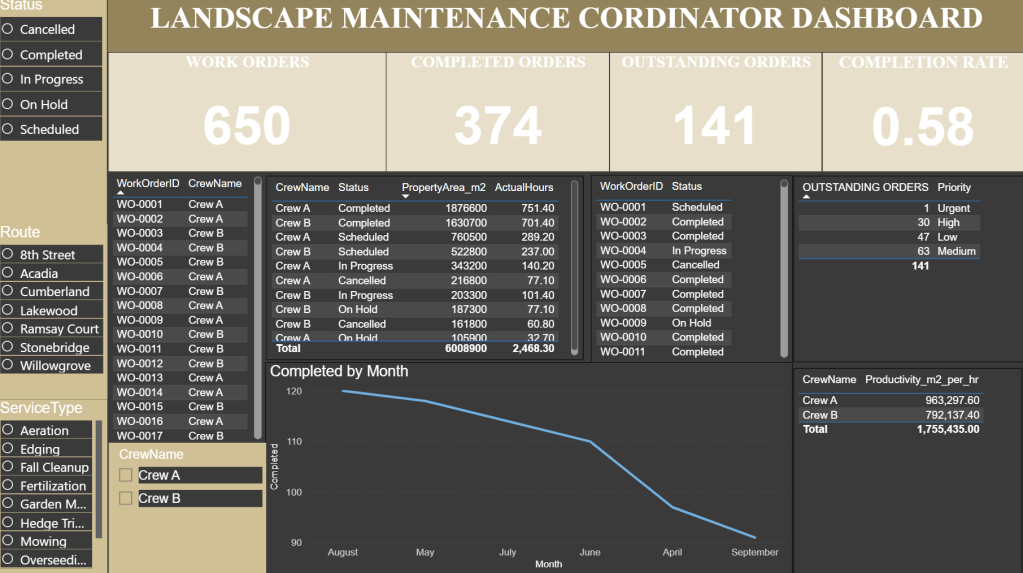
- The dashboard records 650 work orders, of which 374 are completed. The displayed completion rate is 0.58, or approximately 58%.
- 141 outstanding orders are shown. Their priority mix is 1 urgent, 30 high, 63 medium, and 47 low, so medium-priority work forms the largest outstanding group.
- Total actual hours are 2,468.30 compared with 2,483.60 estimated hours, indicating overall delivery was close to planned effort.
- Completed orders are highest in August at about 120 and decline to about 91 in September in the monthly view.
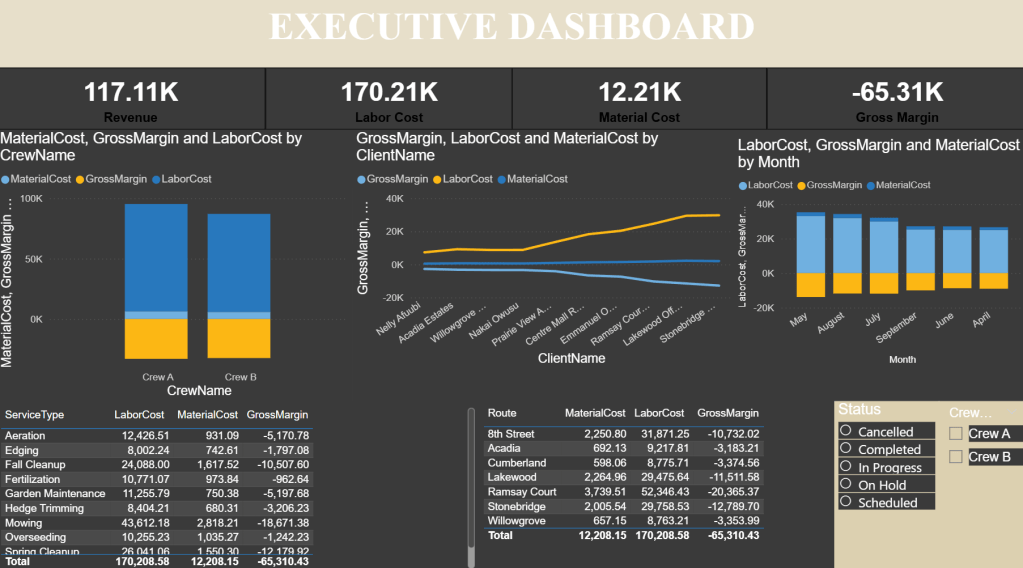
- The executive page reports 117.11K revenue, 170.21K labor cost, 12.21K material cost, and a -65.31K gross margin. Labor is therefore the dominant cost and total costs exceed revenue.
- Every listed route has a negative gross margin. Ramsay Court shows the largest loss at approximately -20.37K, followed by Stonebridge at about -12.79K and Lakewood at about -11.51K.
- The service table also shows negative gross margin across visible service types. Mowing has the highest visible labor cost and a gross margin of approximately -18.67K.
- The productivity summary shows Crew A ahead of Crew B on the dashboard’s square-metres-per-hour measure, suggesting stronger area coverage per labor hour for Crew A.
Visualizations
The report uses KPI cards to highlight work-order and financial totals at a glance. A monthly line chart shows the trend in completed orders, while crew, client, route, service-type, and monthly comparisons reveal how labor cost, material cost, and gross margin vary across the operation. Detailed tables support transaction-level checking, and slicers for status, route, service type, crew, date, priority, and client type enable focused analysis.
Outcome
The finished dashboard provides a single, decision-ready view of landscape maintenance performance. Coordinators can monitor workload, status, priority, crew assignment, and monthly completion patterns, while executives can identify cost pressure and unprofitable routes or services. The analysis makes the central business issue clear: operational delivery is broadly aligned with estimated hours, but the current cost structure especially labor is producing a substantial negative gross margin. This creates a practical basis for reviewing pricing, crew deployment, route efficiency, service mix, and cost controls.


Leave a Reply