Project Overview
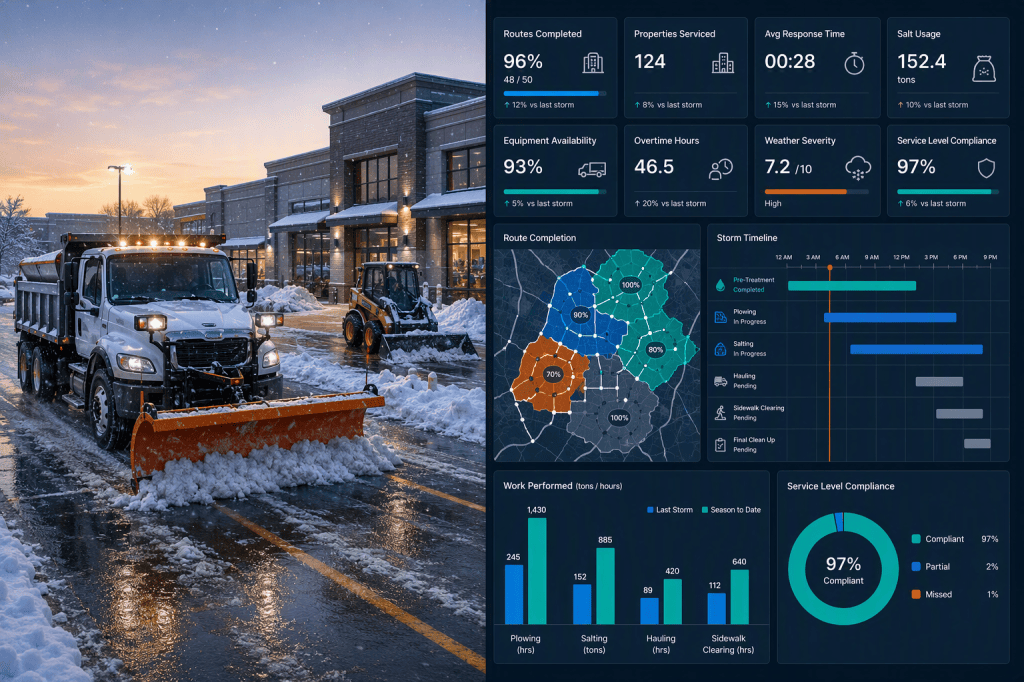
A snow-removal operations analytics project designed to evaluate how effectively winter snow events are planned, staffed, executed, and completed. The project transforms operational snow-removal data into actionable insights on service demand, crew productivity, resource utilization, costs, and completion performance.
The Problem
Snow events can create significant operational pressure for landscape companies. Managers need to know:
- How many properties need service?
- How much crew time is required?
- Are crews completing scheduled work?
- What does each snow event cost?
- Where are operational delays or resource gaps occurring?
The project addresses these questions by analyzing snow-event and service-operation data.
Data used
This project uses a synthetically generated dataset created for portfolio and demonstration purposes and does not represent real company, customer, employee, or financial data. The dataset simulates snow-removal operations, including snow events, crews, service times, completion status, and operational costs. It was designed to replicate a realistic winter operations environment for demonstrating data cleaning, QA/QC, data modeling, DAX calculations, and Power BI analysis. All findings are therefore illustrative and intended to demonstrate the analytical approach rather than represent actual industry performance.
Tools
Excel
- Initial data organization
- Data inspection
- Basic calculations
Power Query
- Data cleaning
- Transformation
- Standardization
- QA/QC
Power BI
- Data modeling
- DAX calculations
- Interactive dashboard
- KPI reporting
- Operational visualization
Process
1. Acquire Data
Collected/created snow-event, property, crew, and work-order data.
2. Clean Data
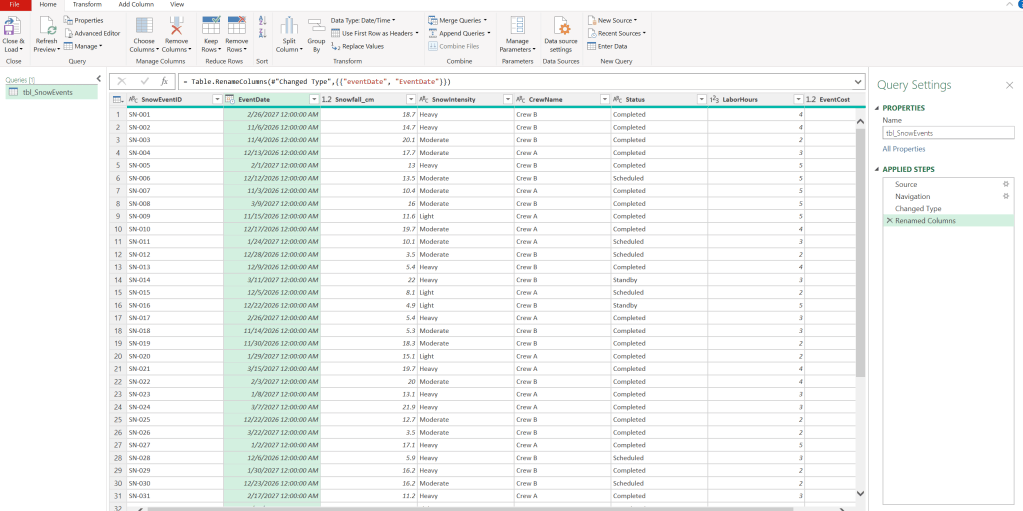
Renamed Column to make sure column names are standardized, checked for missing data and validated operational records.
3. QA/QC
Checked crew hours, service completion, equipment usage, material quantities, and cost calculations for inconsistencies.
4. Transform Data
Used Power Query to prepare the datasets for analysis.
5. Build Data Model
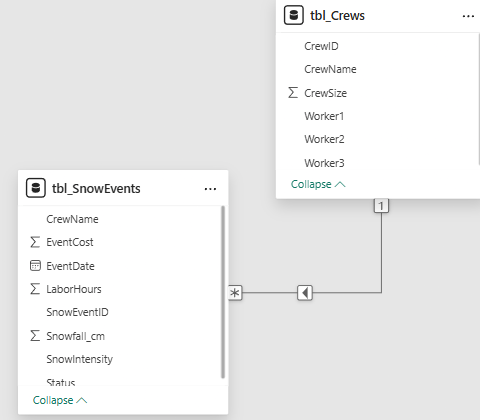
Connected snow events with crews.
6. Create DAX Measures
Calculated metrics such as:
- Completion rate
- Crew hours
- Properties completed
- Cost per event
- Scheduled vs. actual hours
- Heaviest Snowfall
Total Snowfall =
SUM(SnowOperations[Snowfall_cm])

Number of Snowfall Events =
DISTINCTCOUNT(SnowOperations[SnowEventID])

Total Labor Hours =
SUM(SnowOperations[LaborHours])

Heaviest Snowfall =
MAX(SnowOperations[Snowfall_cm])

Total Event Cost =
SUM(SnowOperations[EventCost])

Completed Events =
CALCULATE(
    DISTINCTCOUNT(SnowOperations[SnowEventID]),
    SnowOperations[Status] = "Completed"
)

Completion % =
DIVIDE(
    [Completed Events],
    [Number of Snowfall Events],
    0
)
7. Build Dashboard
Created an interactive Power BI dashboard for monitoring snow-event performance.
Key Finding
The dashboard summarizes 45 snow events with 564.5 cm of total snowfall.The heaviest snowfall was 22.0 cm, associated with event SN-014, which was on standby.Total labour usage was 148 hours, averaging about 3.29 hours per event.Crew B used 82 hours (55.4%), compared with 66 hours (44.6%) for Crew A.Total event cost was $47,702.28, averaging approximately $1,060.05 per event.Event status was approximately:
- 35 completed
- 8 scheduled
- 2 on standby
The completion rate is about 77.8%. Event costs vary substantially even for similar snowfall levels so cost is likely influenced by labour hours, snow intensity, crew assignment, or event duration, not snowfall alone.
Visualizations
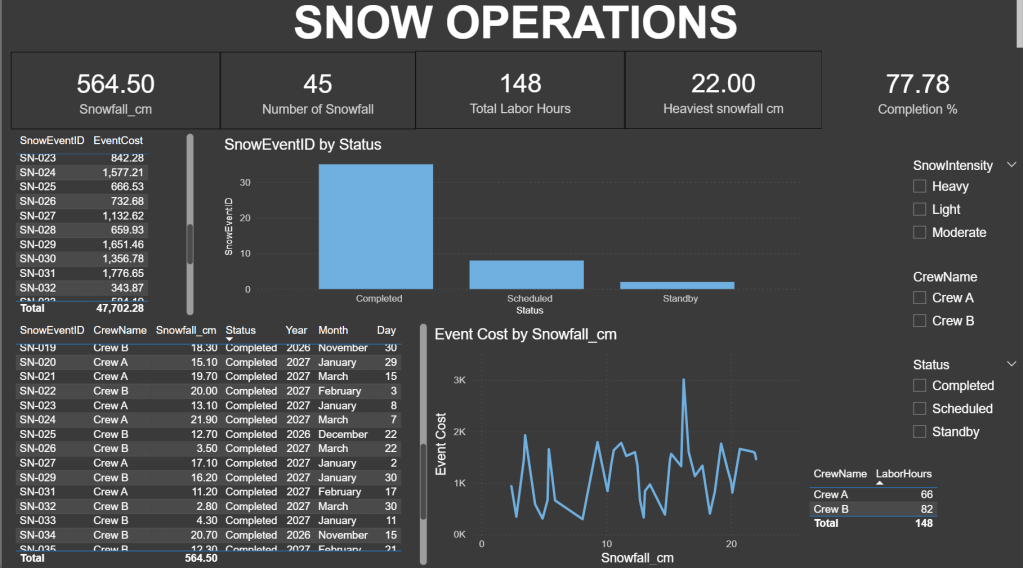
KPI cards showing total snowfall, number of events, total labour hours, heaviest snowfall, and completion rate
Column chart showing event counts by Completed, Scheduled, and Standby status
Line chart comparing event cost with snowfall amount
Event-cost table listing each SnowEventID and its cost, with a total
Operational-detail table showing event ID, crew, snowfall, status, year, month, and day
Crew labour table comparing labour hours for Crew A and Crew B
Interactive slicers for snow intensity, crew name, and event status
Outcome
The project demonstrates how snow-removal companies can use operational data to move from reactive winter-service management to data-driven operations.
The dashboard provides managers with a centralized view of snow-event demand, workforce productivity, service completion, and operational costs, supporting better crew scheduling, resource allocation, cost control, and post-event reporting.


Leave a Reply