
Project Overview
The objective of this project was to analyze tree measurements and estimate carbon dioxide sequestration using tree-level characteristics such as diameter and height.
The analysis involved preparing tree measurement data, calculating derived variables, estimating tree weight and carbon content, calculating annual CO₂ sequestration, and examining relationships between tree characteristics.
The Problem
Forest and tree measurements can be used to estimate carbon storage and understand relationships between tree characteristics.
The analytical problem addressed in this project was to transform basic tree measurements into useful carbon-related metrics and investigate whether tree characteristics such as diameter and height are associated with differences in estimated carbon sequestration.
The analysis also examined the relationship between tree diameter, height, volume, and calculated carbon-related variables.
Data Used
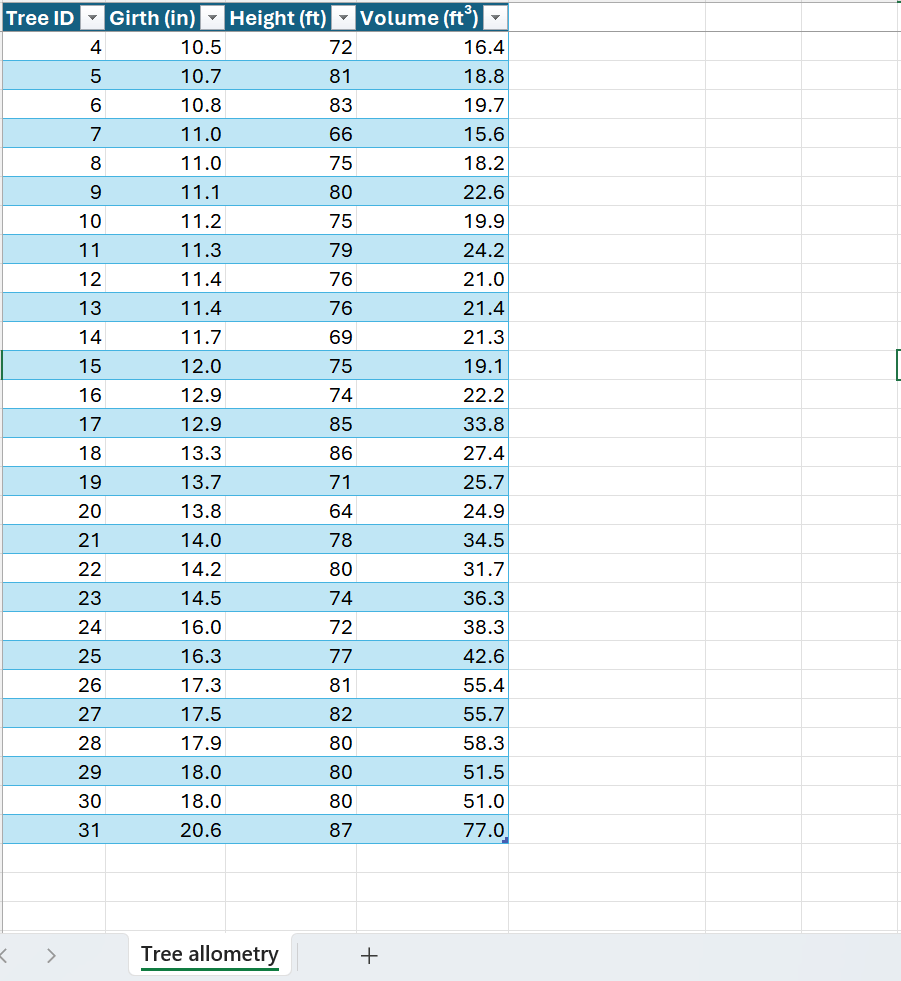
The project used a CSV dataset containing tree-level measurements.
The source data contained the following primary variables:
- Plant ID
- Girth
- Height
- Volume
The dataset contains 31 tree observations, with measurements of girth, height, and volume for each plant.
The project then created additional variables required for the analysis and carbon calculations.The original dataset consisted of:
| Variable | Description |
| Plant ID | Unique identifier for each tree |
| Girth | Tree girth measurement |
| Height | Tree height measurement |
| Volume | Tree volume measurement |
The analysis subsequently created additional variables including:
- Diameter
- Height_inches
- Dia_Squared
- Weight
- Dry_Weight
- Carbon_Weight
- C02_Weight
- C02_per_year
The uploaded analysis shows that the original Girth field was copied into a Diameter field and the original Girth column was subsequently removed from the working dataset.
Tools
The project was completed using Python as the primary data-analysis environment.
The main Python libraries and tools used were:
- Pandas — used for importing the CSV dataset, inspecting the data, checking missing observations, examining data types, creating and modifying columns, and performing data preparation.
- NumPy — imported as part of the Python analytical environment for numerical analysis.
- Matplotlib — used to create the scatter plot examining the relationship between tree diameter and height.
- Seaborn — used to create the correlation heatmap, regression visualization, and CO₂ sequestration bar chart.
- CSV — used as the source data format containing the tree-level measurements.
The analysis was therefore completed primarily through a Python-based data analysis workflow, combining data preparation, numerical calculations, correlation analysis, and visualization.
Process
Data Cleaning & QA/QC
Python and Pandas were used to inspect and prepare the dataset.
Data inspection
The analysis first loaded the CSV file using Pandas and examined the data using head().
Missing-data check
A missing-observation check was performed using Pandas’ isnull functionality.
Data-type check
The project checked the data types of the variables. The resulting types included:
- Plant ID — integer
- Girth — float
- Height — integer
- Volume — float
Variable preparation
The analysis created a Diameter variable from the Girth field and removed the original Girth field from the working dataset.
The analysis also included a duplicate-removal step using drop_duplicates.
Data Transformation & Feature Engineering
Several derived variables were created to prepare the dataset for the carbon calculations.
Height conversion
Tree height was converted into inches:
df1[‘Height_inches’] = df1[‘Height’] * 0.0328
Squared diameter
A squared diameter variable was created:
df1[‘Dia_Squared’] = df1[‘Diameter’] * df1[‘Diameter’]
These derived variables were then used in subsequent biomass and carbon calculations.
Carbon Calculation
The project applied a procedure identified in the notebook as the University of Nebraska procedure for the calculation of carbon dioxide.
The calculations followed several stages.
Estimated weight
df1[‘Weight’] = (df1[‘Dia_Squared’] * 0.15) * df1[‘Height_inches’]
Dry weight
df1[‘Dry_Weight’] = df1[‘Weight’] * 0.725
Carbon weight
df1[‘Carbon_Weight’] = df1[‘Dry_Weight’] * 0.5
CO₂ weight
df1[‘C02_Weight’] = df1[‘Carbon_Weight’] * 3.6663
Annual CO₂ sequestration
df1[‘C02_per_year’] = df1[‘C02_Weight’] / 5
These calculations produced tree-level estimates for weight, dry weight, carbon weight, total CO₂ weight, and estimated annual CO₂ sequestration.
Correlation Analysis
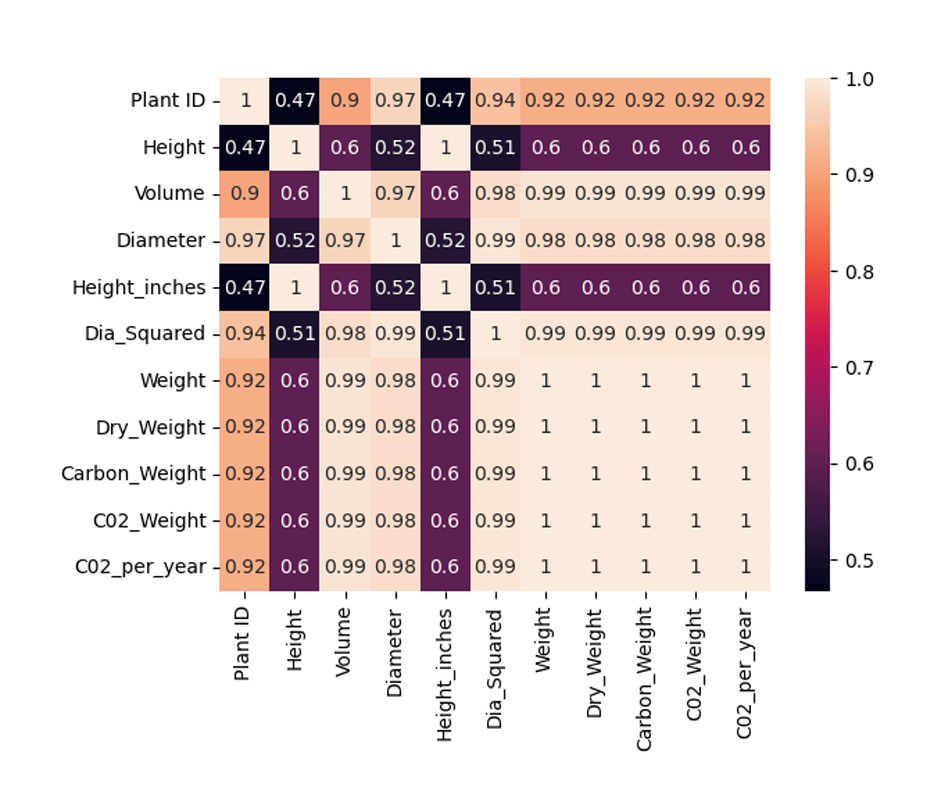
A correlation matrix was generated to examine relationships between the variables.
df_correlation = df1.corr()
The analysis found strong positive correlations between several tree and derived characteristics.
For example, the correlation output shows:
- Diameter and Volume: approximately 0.967
- Diameter and Dia_Squared: approximately 0.993
- Diameter and Weight: approximately 0.980
- Volume and Weight: approximately 0.989
A correlation heatmap was also created to visualize these relationships.
Key Findings
The analysis demonstrates several relationships within the tree dataset.
Diameter and volume
Diameter has a strong positive correlation with volume, with a reported correlation of approximately 0.967.
Diameter and calculated weight
Diameter also has a strong positive relationship with calculated weight, with a correlation of approximately 0.980.
Volume and calculated weight
Volume has an approximately 0.989 correlation with calculated weight.
Tree-level CO₂ estimates
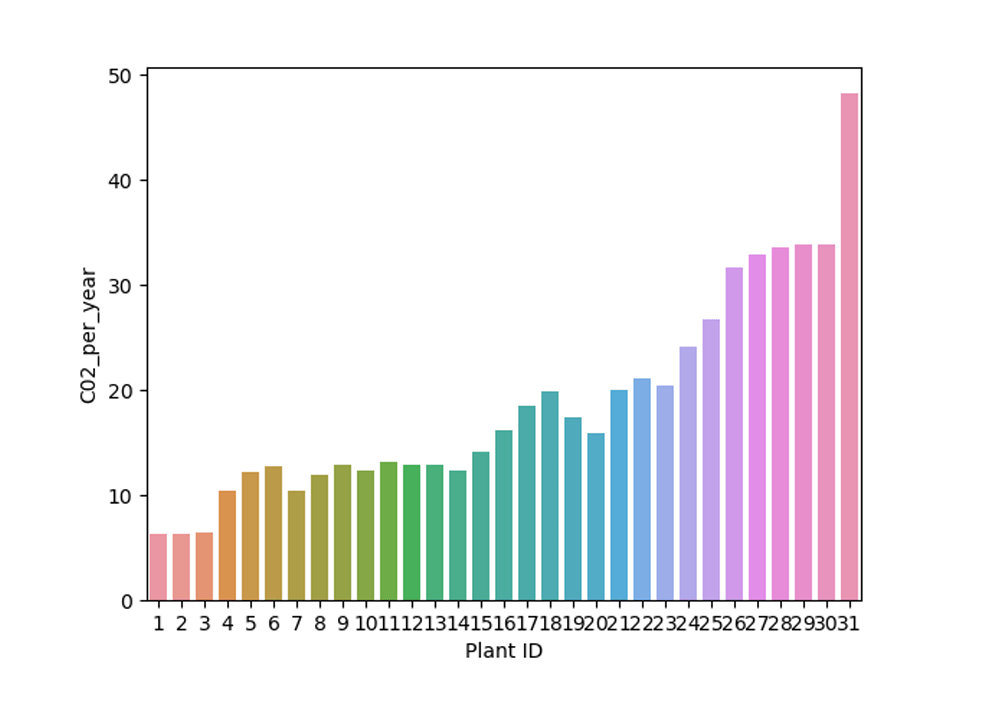
The analysis calculated estimated annual CO₂ sequestration for each tree. For example, the first five observations have estimated annual values of approximately:
- Plant 1: 6.31
- Plant 2: 6.29
- Plant 3: 6.38
- Plant 4: 10.38
- Plant 5: 12.13
Visualization
The project included several visualizations.
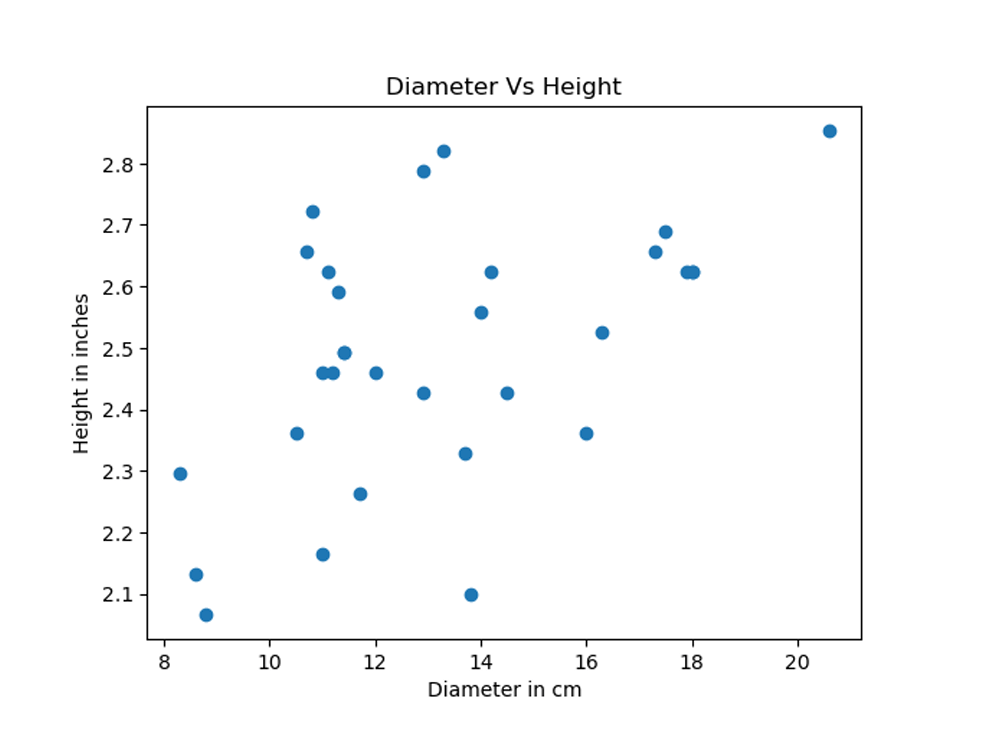
Diameter vs. Height
A scatter plot was created to examine the relationship between tree diameter and height.
plt.scatter(
x=df1[‘Diameter’],
y=df1[‘Height_inches’]
)
The visualization uses:
- X-axis: Diameter in cm
- Y-axis: Height in inches
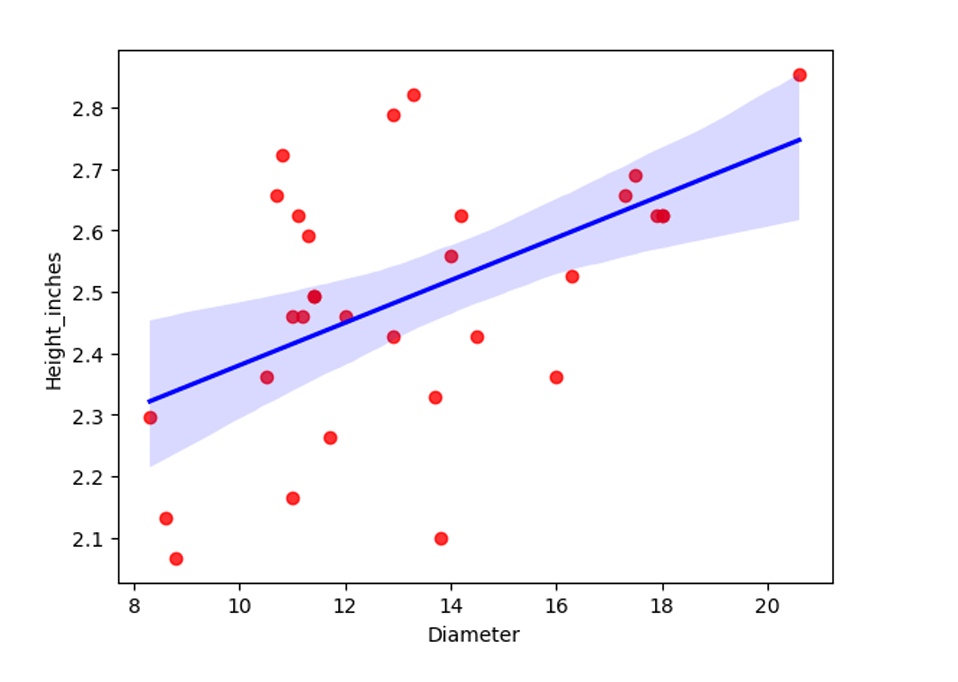
A regression visualization was also created using Seaborn’s regplot to show the relationship between diameter and height.
sns.regplot(x='Diameter', y='Height_inches',data=df1, scatter_kws={'color': ↪'red'}, line_kws={'color':'blue'})
CO₂ sequestration by tree
A bar chart was created to display estimated annual CO₂ sequestration for individual trees using Plant ID and C02_per_year.
sns.barplot(x='Plant ID',y='C02_per_year',data=df1)
Correlation heatmap
A correlation heatmap was used to provide a visual overview of relationships among the measured and calculated variables.
sns.heatmap(df_correlation, annot=True)
Outcome
The project transformed a basic tree-measurement dataset into an analytical dataset containing estimated biomass, carbon weight, CO₂ weight, and annual CO₂ sequestration.
The analysis demonstrates an end-to-end Python data-analysis workflow involving:
- Data import
- Data inspection
- Missing-data checking
- Data-type validation
- Data cleaning
- Feature engineering
- Carbon calculations
- Correlation analysis
- Statistical visualization
The project also demonstrates how environmental and forestry data can be transformed into quantitative indicators that can support analysis of forest carbon characteristics.


Leave a Reply