
Project Overview
This project analyzes corporate ESG performance using Microsoft Power BI, focusing on the relationship between carbon emissions, ESG scores, revenue, and sector performance. The goal was to transform corporate sustainability data into interactive visual insights that can help stakeholders understand how environmental performance relates to overall business performance.
The Problem
Companies increasingly need to balance financial performance with environmental responsibility. However, strong revenue does not necessarily indicate strong ESG performance.
The analysis aimed to answer key questions:
- Which companies have the highest and lowest ESG scores?
- How do carbon emissions vary across companies?
- Is there a relationship between carbon emissions and ESG performance?
- Can companies achieve strong financial performance while maintaining strong ESG performance?
- How does ESG performance vary across sectors?
Data Used
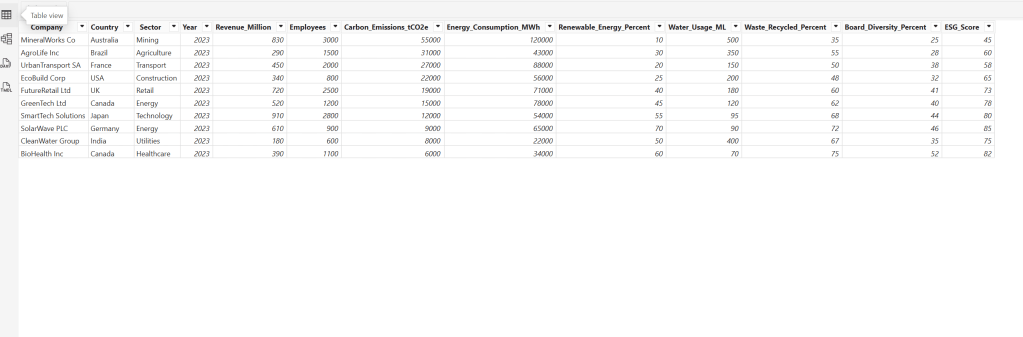
The dataset contains corporate-level information covering:
- Company
- Sector
- Revenue ($ millions)
- Carbon emissions (tCO₂e)
- ESG score
The analysis included 10 companies across sectors including healthcare, energy, technology, utilities, retail, construction, agriculture, transport, and mining.
Tools
Microsoft Power BI
Power Query – data preparation and transformation
DAX – calculations and analytical measures
Total Carbon Emissions =
SUM(ESG_Data[Carbon_Emissions_tCO2e])

Average Carbon Emissions per Company =
AVERAGEX(
    VALUES(ESG_Data[Company]),
    CALCULATE(SUM(ESG_Data[Carbon_Emissions_tCO2e]))
)

Average ESG Score =
AVERAGE(ESG_Data[ESG_Score])

Total Revenue =
SUM(ESG_Data[Revenue_Million])


Average Revenue per Company =
AVERAGEX(
    VALUES(ESG_Data[Company]),
    CALCULATE(SUM(ESG_Data[Revenue_Million]))
)

ESG Score by Sector =
AVERAGE(ESG_Data[ESG_Score])

ESG Score Ranking =
RANKX(
    ALLSELECTED(ESG_Data[Company]),
    CALCULATE(AVERAGE(ESG_Data[ESG_Score])),
    ,
    DESC,
    DENSE
)
Top ESG Company =
VAR TopCompany =
    TOPN(
        1,
        ALLSELECTED(ESG_Data[Company]),
        [Average ESG Score],
        DESC,
        ESG_Data[Company],
        ASC
    )
RETURN
    CONCATENATEX(TopCompany, ESG_Data[Company], ", ")

   Company ESG Score =
AVERAGE(ESG_Data[ESG_Score])

Company Carbon Emissions =
SUM(ESG_Data[Carbon_Emissions_tCO2e])

Revenue by Company =
SUM(ESG_Data[Revenue_Million])

ESG Score by Company =
AVERAGE(ESG_Data[ESG_Score])
Data visualization – interactive charts and KPI analysis
Process
Imported the corporate ESG dataset into Power BI.
Prepared and structured the data for analysis.
Reviewed company-level ESG scores, revenue, and carbon emissions.
Created measures and visualizations to compare company performance.
Analyzed the relationship between ESG scores and carbon emissions.
Compared revenue against ESG performance.
Examined ESG performance across different sectors.
Developed an interactive Power BI dashboard for presenting the results.
Key Findings
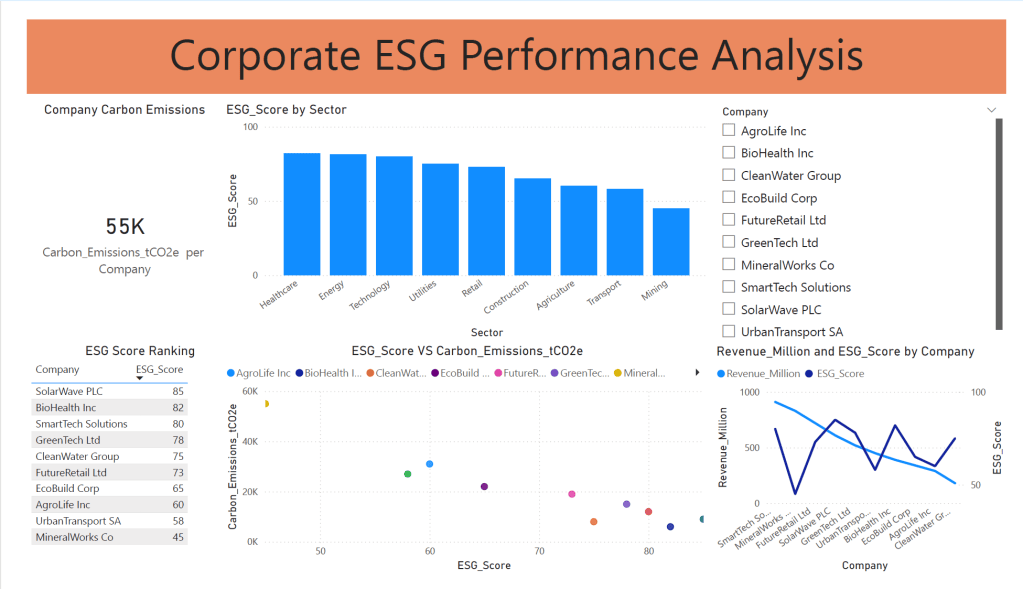
SolarWave PLC recorded the highest ESG score at 85, followed by BioHealth Inc at 82 and SmartTech Solutions at 80.
MineralWorks Co. recorded the lowest ESG score at 45, while AgroLife Inc and UrbanTransport SA recorded 60 and 58 respectively.
The analysis shows an apparent relationship between higher carbon emissions and lower ESG scores. SmartTech Solutions demonstrates that strong revenue performance can coexist with a relatively high ESG score.
SolarWave PLC combines a high ESG score with comparatively low carbon emissions.
MineralWorks Co. represents a contrasting case, with the lowest ESG score and the highest carbon-emissions level in the dashboard.
The analysis also highlights differences in ESG performance across sectors.
Visualization
The Power BI dashboard includes:
- Carbon Emissions by Company – compares tCO₂e emissions across organizations.
- ESG Score Ranking – ranks companies based on ESG performance.
- ESG Score by Sector – compares sustainability performance across industries.
- ESG Score vs. Carbon Emissions – explores the relationship between environmental emissions and ESG performance.
- Revenue vs. ESG Score – compares financial performance with sustainability performance.
Outcome
The project demonstrates how Power BI can transform ESG data into actionable business intelligence. The analysis provides a consolidated view of environmental performance, ESG scores, revenue, and sector-level differences.
The key insight from the analysis is that financial performance and sustainability performance should be evaluated together rather than independently. The dashboard provides a foundation for identifying companies that combine strong business performance with stronger ESG outcomes, while also highlighting areas where environmental performance may require further attention.


Leave a Reply