
Project Overview
This project analyzes field-level precision agriculture data to understand the factors associated with crop yield variation. Using SQL and Power BI, the analysis examines crop performance across years, fields, and rotations, while investigating the relationships between yield, nitrogen application, soil characteristics, weather conditions, and terrain.
The Problem
Agricultural productivity can vary considerably across fields and growing seasons. Farmers and agricultural managers need data-driven insights to understand where yield variation occurs and which environmental and management factors may be associated with productivity.
The objective of this project is to transform raw agricultural data into actionable insights that can support better understanding of crop performance and field variability.
Data Used
The dataset was downloaded from USDA Agricultural Research Service (USDA-ARS) / Data.gov. https://www.ars.usda.gov/research/project?accnNo=441606&showpubs=true&utm_source=chatgpt.com
The dataset contains field-level agricultural observations, including:
- Crop and year
- Field and crop rotation
- Grain yield (kg/ha)
- Nitrogen fertilizer application (kg/ha)
- Soil sand and carbon percentages
- Spring and summer precipitation
- SPEI drought indices
- Elevation
- Slope
- Topographic wetness index (TWI)
- Topographic position index (TPI)
- Solar radiation and terrain characteristics
- UTM spatial coordinates
The dataset was imported into MySQL and prepared for analysis before being connected to Power BI.
Tools
MySQL — data storage, cleaning, validation, aggregation, and statistical analysis
Microsoft Power BI — interactive dashboards and data visualization
DAX — calculated measures and KPI development
Average Yield =AVERAGE('model_data_1'[yield_kg_ha])Total Observations =COUNTROWS('model_data_1')Average Nitrogen =AVERAGE('model_data_1'[N_Kg_ha])Average Soil Carbon =AVERAGE('model_data_1'[soil_carbon])Maximum Yield =MAX('model_data_1'[yield_kg_ha])Minimum Yield =MIN('model_data_1'[yield_kg_ha])Number of Crops =DISTINCTCOUNT('model_data_1'[crop])Average Nitrogen for Scatter =AVERAGE('model_data_1'[N_Kg_ha])Average Yield for Scatter =Average Yield])
Excel — initial data inspection and validation
Process
Imported the raw agricultural dataset into MySQL.
CREATE DATABASE Precision_agric;USE Precision_agric;
Verified the database structure and data types.
SHOW DATABASESSHOW TABLES;SELECT*FROM model_data_2LIMIT 10;
Investigated the number of observations and crop categories.
Created a separate cleaned analytical table while preserving the raw dataset.
Checked for missing values and duplicate observations.
alter table model_data_1rename column slope TO slope_percentage;
select count(*) as ttotals, sum(northing_UTM13N IS NULL) AS missing_north, sum(yield_kg_ha IS NULL) AS missing_yield, sum(crop IS NULL) AS missing_crop, sum(year IS NULL) AS missing_year, sum(rotation IS NULL) AS missing_rotation, sum(field IS NULL) AS missing_field, sum(N_Kg_ha IS NULL) AS missing_nitrogenFROM model_data_2;select northing_UTM13N,crop,year,field,yield_kg_ha,rotation,count(*) AS Duplicate_countsFROM model_data_2GROUP BY northing_utm13N,crop,year,field,yield_kg_ha,rotationHAVING count(*)>1;
Investigated invalid, duplicates and inconsistent values.
select distinct rotation,crop,field from model_data_2;select*FROM model_data_2where northing_UTM13N = 4446092.296AND crop ='Wheat'AND year = 2022and field = 'S2';
Connected the cleaned MySQL table to Power BI.
Created DAX measures, slicers, KPI cards, charts, and interactive dashboard pages.
Key Findings
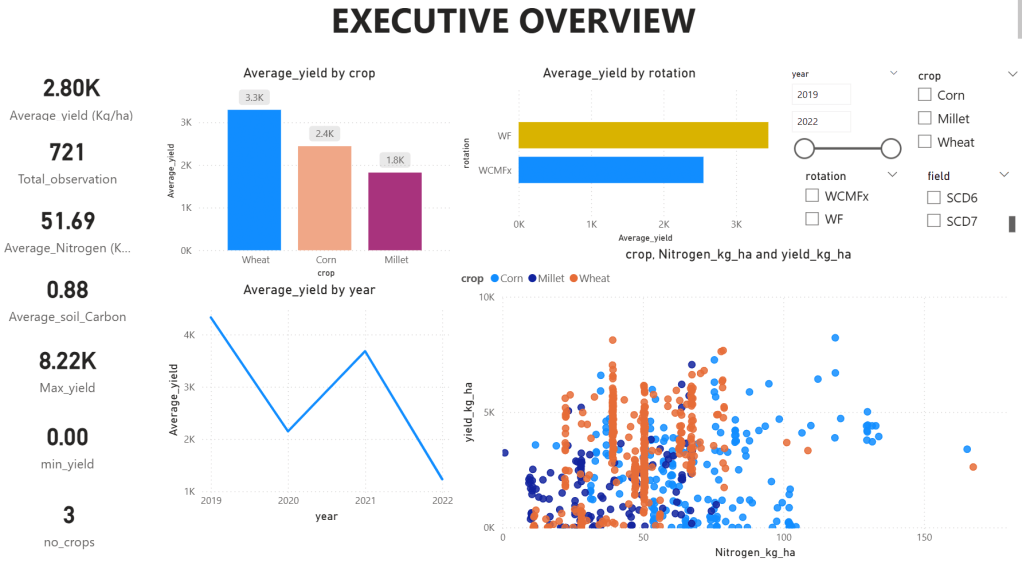
Overall performance: The dataset contains 721 observations, with an average yield of approximately 2,800 kg/ha.
Wheat performs best: Wheat has the highest average yield at about 3,300 kg/ha, followed by corn at 2,400 kg/ha and millet at 1,800 kg/ha.Rotation matters:
The WF rotation averages roughly 3,500 kg/ha, compared with about 2,500 kg/ha for WCMFx—approximately 1,000 kg/ha higher.
Yield varies considerably by year: Average yield was highest in 2019, declined sharply in 2020, recovered in 2021, and fell to its lowest level in 2022. This suggests that weather, field conditions, management practices, or crop mix may have had a strong annual effect.
Nitrogen has an inconsistent relationship with yield: Higher yields occur more frequently at moderate-to-high nitrogen rates, but the scatter plot is widely dispersed. Nitrogen alone therefore does not explain yield performance.
Crop response differs: Corn, wheat, and millet show different yield distributions across nitrogen levels, suggesting that fertilizer recommendations should be crop-specific rather than uniform.
There are possible anomalies: Yield ranges from 0 to about 8,220 kg/ha. The zero-yield records and extreme values should be checked to determine whether they represent crop failure, missing measurements coded as zero, or valid observations.
Soil carbon is relatively low on average: The reported average is 0.88, although its significance depends on the unit and measurement method used in the source data.
Management implication: The strongest opportunities appear to be selecting the better-performing crop–rotation combinations and optimizing nitrogen by crop, field, and year rather than simply increasing application rates.
Visualization
The Power BI dashboard provides interactive views of agricultural productivity through:
- Average yield by crop
- Yield trends by year
- Yield by field and rotation
- Nitrogen application versus yield
- Soil characteristics and yield
- The Power BI dashboard provides interactive views of agricultural productivity through:
- Average yield by crop
- Yield trends by year
- Yield by field and rotation
- Nitrogen application versus yield
- Soil characteristics and yield
Outcome
The project demonstrates an end-to-end data analytics workflow, from raw agricultural data to an interactive business-style dashboard.
It combines SQL data management and statistical analysis with Power BI visualization to demonstrate how agricultural datasets can be transformed into meaningful insights for understanding crop productivity and field-level variation.
The project also demonstrates practical skills in data cleaning, exploratory analysis, SQL, DAX, data visualization, and agricultural data interpretation.


Leave a Reply