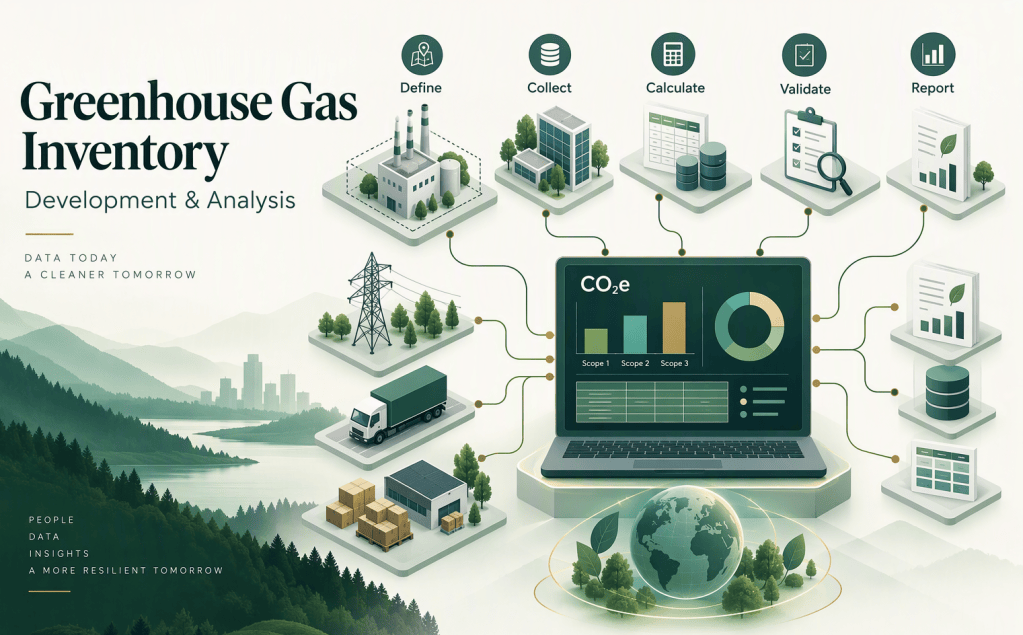
Project Overview
This project analyzes a fictional mining operation’s 2025 greenhouse gas (GHG) emissions inventory to evaluate its carbon footprint, energy use, and emissions performance relative to production.
The objective was to consolidate fuel consumption, purchased electricity, and production data into a monthly inventory, identify emissions trends, and provide management with data-driven opportunities for emissions reduction and energy efficiency.
Key objectives:
- Quantify Scope 1 and Scope 2 emissions.
- Track GHG intensity relative to ore processed and gold produced.
- Identify high-emission periods and potential improvement opportunities.
- Develop performance indicators to support sustainability reporting and energy management.
The Problem
Mining operations consume substantial amounts of fuel and electricity. Without a reliable emissions inventory, management may struggle to identify emission sources, monitor performance, evaluate decarbonization initiatives, and verify progress toward sustainability targets.
The main challenges addressed in this project were:
- Ensuring consistent emission factors, units, and calculation methods.
- Distinguishing changes in total emissions from changes in emissions intensity.
- Translating monthly emissions results into actionable management insights.
Data Used
The analysis used six worksheets from the project workbook.
| Dataset | Key variables | Purpose |
|---|---|---|
| Raw fuel consumption | Equipment, department, fuel type, consumption | Identify missing data and quality issues |
| Cleaned fuel consumption | Equipment, fuel consumed, Scope 1 emissions | Calculate direct emissions |
| Electricity | Department, electricity consumed, Scope 2 emissions | Calculate indirect electricity emissions |
| Production | Ore processed, gold produced, operating hours | Measure operational performance |
| Emission factors | Fuel and electricity factors | Convert activity data into emissions |
| Monthly inventory | Scope 1, Scope 2, total emissions, intensity | Consolidated performance analysis |
Emission factors used in the fictional dataset:
- Diesel: 2.68 kg CO₂e/L
- Gasoline: 2.31 kg CO₂e/L
- Purchased electricity: 0.12 kg CO₂e/kWh
These are illustrative project assumptions, not verified site-specific or regulatory emission factors.
Tools
- Microsoft Excel: Data inspection, initial calculations, and validation.
- Power Query: Data cleaning, transformation, and preparation.
- Power BI: Dashboard development and performance monitoring.
- DAX: Emissions totals, intensity measures, monthly comparisons, and KPI calculations.
Process
Step 1: Data collection and consolidation
Reviewed the fuel consumption, electricity, production, and emission-factor worksheets and aligned the datasets using the monthly reporting period.
Step 2: Data cleaning and quality assurance
Inspected missing fuel-consumption values, inconsistent records, units, duplicate entries, and calculation discrepancies. Used the cleaned fuel dataset for the consolidated inventory and retained the raw dataset for quality-control review.
Step 3: Emissions calculation
Calculated direct fuel-combustion emissions using:
Scope 1 emissions
Emissions (t CO₂e) = Fuel consumed (L) × Emission factor (kg CO₂e/L) ÷ 1,000
Scope 2 emissions
Emissions (t CO₂e) = Electricity consumed (kWh) × Emission factor (kg CO₂e/kWh) ÷ 1,000
Total emissions
Total Scope 1 and Scope 2 = Scope 1 + Scope 2
Step 4: KPI development
Calculated monthly total emissions, emissions per tonne of ore processed, emissions per kilogram of gold produced, fuel type consumption, ratio of scope 1 and 2, trend in emission and emission intensity per month and department use of electricity.
Step 5: Trend and performance analysis
Compared monthly results to identify higher-emission periods, lower-intensity periods, and opportunities to investigate operational and energy-efficiency improvements.
Step 6: Dashboard development
Designed a Power BI dashboard to communicate emissions performance, energy-related trends, production context, and management priorities.
Key Findings
Annual emissions profile
The fictional operation recorded approximately 4,005.72 t CO₂e in combined Scope 1 and Scope 2 emissions during 2025.
- Scope 1 emissions: 2,113.32 t CO₂e.
- Scope 2 emissions: 1,892.40 t CO₂e.
- Scope 1 accounted for approximately 52.8% of combined emissions.
- Scope 2 accounted for approximately 47.2%.
Direct fuel combustion was the larger emissions category, although purchased electricity contributed nearly half of the total.
Monthly emissions trends
- Highest monthly combined emissions: February, at 355.88 t CO₂e.
- Lowest monthly combined emissions: May, at 319.08 t CO₂e.
- Monthly emissions varied throughout the year, indicating that performance should be assessed alongside production and operating conditions.
The highest-emission month should be investigated to determine whether the difference resulted from fuel consumption, electricity demand, production conditions, or other operational factors.
GHG emissions intensity
The average monthly emissions intensity was approximately 1.119 kg CO₂e per tonne of ore processed.
- Highest monthly intensity: January, at 1.189 kg CO₂e/t.
- Lowest monthly intensity: May, at 1.023 kg CO₂e/t.
- December intensity was approximately 5.0% lower than January.
This indicates an improvement in emissions per tonne of ore between the beginning and end of the year, although additional analysis would be needed to establish the underlying causes.
Production and emissions relationship
The operation processed approximately 3.59 million tonnes of ore and produced 11,427 kg of gold during 2025.
Comparing emissions with production provides a more meaningful view of operational efficiency than total emissions alone. Higher production can increase absolute emissions while still reducing emissions per unit of output.
The analysis should therefore monitor both absolute emissions and intensity KPIs.
Data quality and inventory reliability
The raw fuel dataset contained a missing fuel-consumption value for one equipment record, while the cleaned dataset contained a value for that record. This highlights the importance of documented data correction, source verification, and an audit trail.
Before external verification or formal sustainability reporting, emission factors, activity data, calculation formulas, and any corrections should be validated against supporting records.
Management Implication
Fuel efficiency and Scope 1 reduction
Prioritize investigation of high-fuel-consuming equipment, including haul trucks, excavators, loaders, and generators. Evaluate idling reduction, preventive maintenance, fuel efficiency, and equipment operating practices.
Electricity optimization and Scope 2 reduction
Review electricity consumption by department, particularly the processing plant. Assess equipment efficiency, operating schedules, energy management practices, and the feasibility of lower-emission electricity options.
Performance targets and accountability
Establish monthly targets for absolute emissions and emissions intensity. Assign responsibility for data quality and performance improvement to the relevant operational departments.
Energy transition decisions
Use the inventory as a baseline for evaluating electrification or other lower-carbon alternatives. Any investment decision should also consider capital cost, operating cost, infrastructure requirements, safety, reliability, and production impacts.
Governance and reporting
Maintain documented calculation methods, approved emission factors, evidence of data validation, and version-controlled records to support internal audits and future external verification.
Visualization
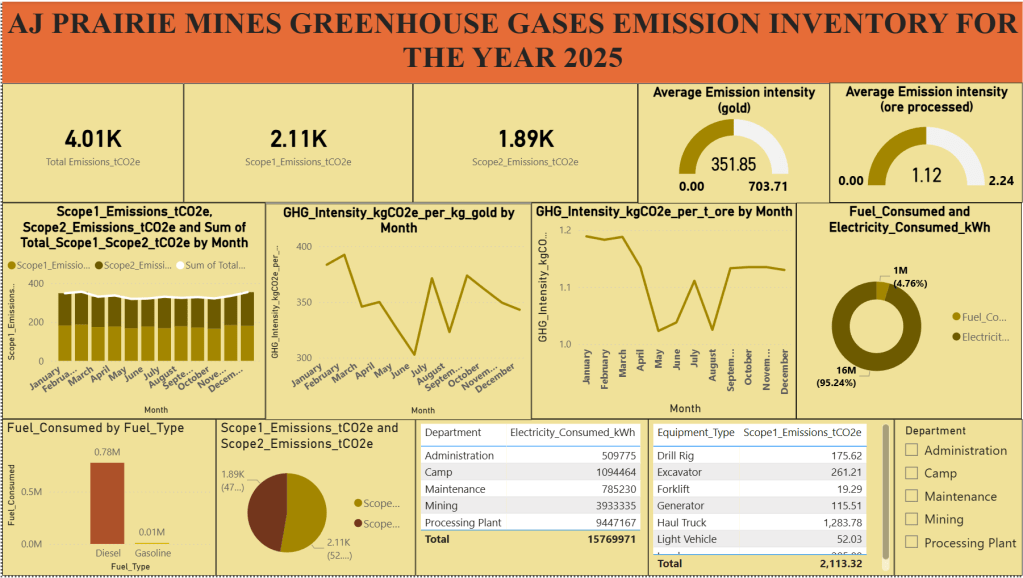
The Power BI dashboard communicates performance through the following visuals:
- KPI cards: Total Scope 1 and Scope 2 emissions, Scope 1 share, Scope 2 share, and average emissions intensity.
- Monthly emissions trend: A line chart showing Scope 1 and Scope 2
- Departmental electricity analysis: A table showing departments and their electricity usage.
- Emissions intensity trend: A line chart of kg CO₂e per tonne of ore and gold processed.
- Equipment emissions analysis: A table identifying major fuel-consuming equipment and associated Scope 1 emissions.
Expected outcome: A consolidated emissions-monitoring tool that helps management understand the emissions profile, identify operational improvement opportunities, track performance against targets, and support evidence-based energy and decarbonization decisions.


Leave a Reply